Mozilla Automation Load Over Time
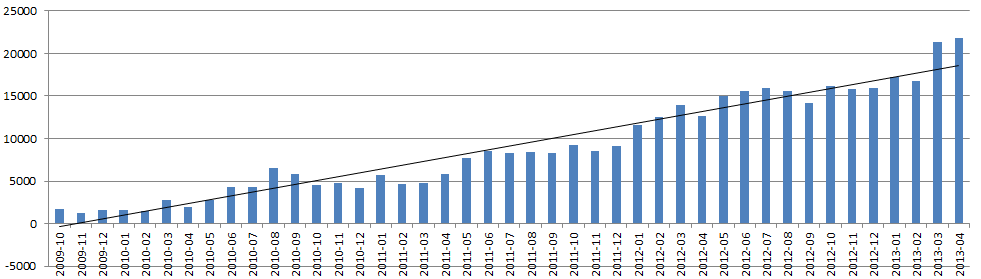
May 06, 2013 at 11:45 AM | categories: MozillaThis chart plots per-month sums of total time of jobs in Mozilla's automation in days. The line running through it is a best fit linear regression.
The raw data is available.